
Udemy
Free Udemy
Free and discounted course coupons, posted every day.
This course is framed as an introduction to data visualization in Excel, with a specific focus on the basics of performance dashboard design — not just charts, but dashboards built to communicate insight clearly.
Aspiring data analysts, business professionals, or anyone who wants to turn raw spreadsheet data into a dashboard that supports real decision-making.
The course pairs theory with direct, hands-on practice rather than staying purely conceptual, so learners are expected to build dashboards themselves as they go — a useful format for anyone who wants Excel skills that translate immediately into a work-ready deliverable.
Mark your own learning status. Opening a course link does not establish enrollment.
Loading saved status…
From the Udemy page
Course "Introduction to Data Visualization dengan Excel" menawarkan pemahaman menyeluruh bagi mahasiswa mengenai konsep visualisasi data, dengan fokus khusus pada dasar-dasar desain dashboard kinerja. Mahasiswa akan menjelajahi prinsip-prinsip dasar merancang, membangun, dan menerapkan dashboard yang efektif dalam menyampaikan wawasan data. Selama pembelajaran, perhatian khusus diberikan pada memberikan mahasiswa keterampilan dan pengetahuan dasar untuk menciptakan dashboard yang menarik secara visual dan informatif yang sesuai dengan kebutuhan tertentu. …
Advertisement
Yes. It's free on Udemy.


Microsoft Excel | Dinamik Dashboard Hazırlama Eğitim Seti
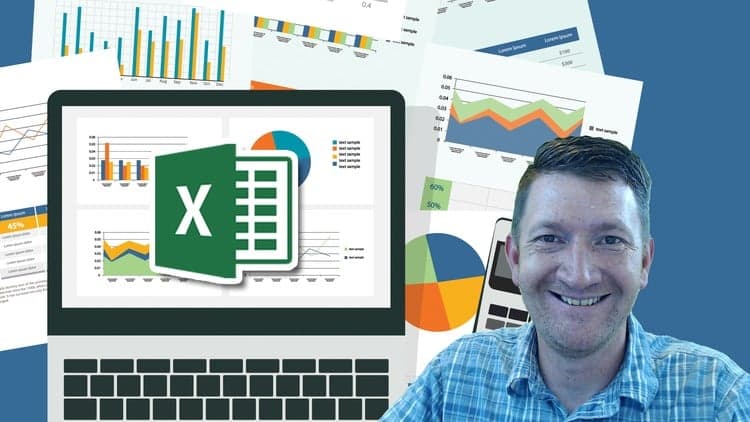
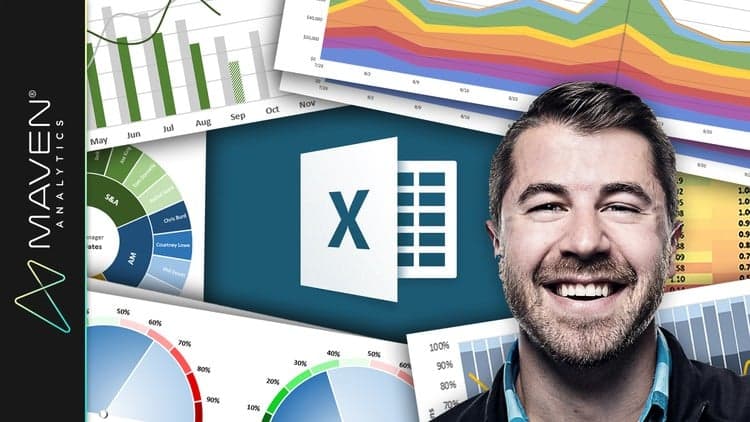
Microsoft Excel: Data Visualization w/ Excel Charts & Graphs
No Korshub reviews yet.