Udemy
 Udemy
UdemyPrice
No active coupon right now
View Course →No coupon right now. We'll tell you when there is one.
Mark your own learning status. Opening a course link does not establish enrollment.
Raw data is a starting point, not an endpoint. This course teaches you to clean messy datasets (handling missing values, duplicates, formatting issues), then analyze them statistically and present findings clearly through visualization and dashboards.
You'll master pivot tables for rapid summarization, advanced formulas like VLOOKUP and INDEX-MATCH for pattern extraction, and conditional formatting to highlight what matters. The progression builds from fundamental techniques to interactive dashboards that help stakeholders grasp complex data at a glance. Whether you're new to data analysis or refining existing skills, you'll gain practical mastery over spreadsheet-driven insights.
Unlock the power of data with our comprehensive "Data Analysis in Excel" course. Designed for beginners and seasoned professionals alike, this course will equip you with essential skills to analyze, visualize, and interpret data effectively using Microsoft Excel.
What You'll Learn:
Data Cleaning and Transformation: Discover techniques for organizing and preparing your datasets to ensure accuracy and consistency. Learn how to handle missing values, duplicates, and formatting issues.
Statistical Analysis: Gain proficiency in using Excel’s built-in statistical functions to perform descriptive and inferential analysis. Understand key concepts such as averages, standard deviations, and hypothesis testing.
Data Visualization: Master the art of creating compelling charts and graphs that clearly communicate your findings. Explore different visualization tools and best practices for presenting data insights.
Pivot Tables and Advanced Formulas: Learn how to use pivot tables to summarize large datasets and uncover trends. Dive into advanced formulas, including VLOOKUP, INDEX-MATCH, and conditional formatting, to enhance your analytical capabilities.
By the end of this course, you will have a solid foundation in data analysis techniques, enabling you to make informed, data-driven decisions in your personal or professional projects. Join us and transform the way you work with data in Excel!
In this "Data Analysis in Excel" course, you will:
Data Cleaning and Preparation:
Techniques to organize and prepare raw data for analysis, including removing duplicates, filling in missing values, and applying data formatting.
Statistical Analysis:
How to utilize Excel's statistical functions for descriptive analysis and inferential analysis to draw meaningful conclusions from your data.
Data Visualization:
Creating a variety of charts and graphs (bar, line, scatter) to effectively communicate insights and trends, along with best practices for visual storytelling.
Pivot Tables:
Mastering pivot tables to summarize and analyze large datasets quickly, allowing for easy exploration of data relationships and patterns.
Advanced Formulas:
Utilizing advanced Excel functions such as VLOOKUP, INDEX-MATCH, and conditional formatting to streamline data analysis and enhance reporting capabilities.
Dashboard Creation:
Building interactive dashboards to present your data visually, enabling stakeholders to understand complex information at a glance.
Advertisement

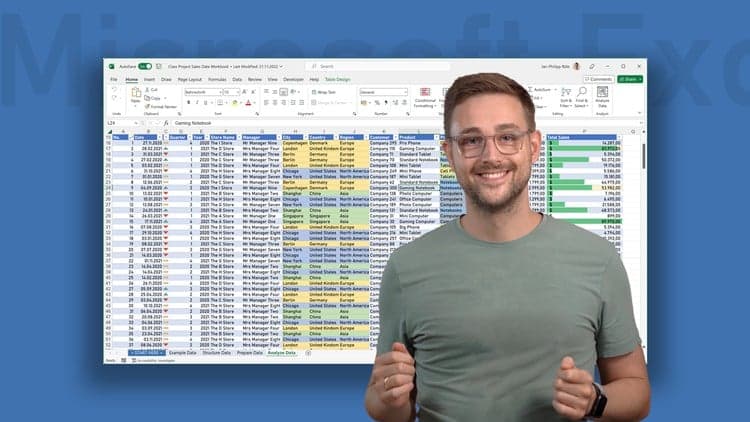
Microsoft Excel Data Analysis - Learn How The Experts Use It
Not the best price we've seen. The lowest we've recorded is $9.99 on 18 Aug.
This is what we recorded in US pricing — not every price this course has ever had, and prices differ by country.