
Udemy
 Udemy
UdemyDeal Price
Coupon code
Opens in a new tab, discount applied automatically
Codes run out fast. We'll tell you if this one's gone and a new one lands.
Mark your own learning status. Opening a course link does not establish enrollment.
This course is designed for aspiring and practicing financial professionals who want to build robust, industry-ready models from the ground up. It balances foundational Excel skills with advanced analytical tools, making it suitable for beginners and those looking to refine their expertise.
With structured modules, real-world assignments, and reflective learning, this course turns Excel from a spreadsheet tool into a strategic asset.
Coupon price: €9.99 on my Udemy instructor dashboard. Korshub displays $9.99 on its USD card; check the final price on Udemy for your region.
Excel Foundations for Financial Modelling: The course begins with an introduction to the instructor's expertise and an overview of the curriculum. Learners will understand why Excel is essential for financial modelling, master navigation through shortcuts, keyboard techniques, dialog boxes, and name ranges. Foundational skills such as absolute and relative references, range naming, and efficient data entry are emphasized, with hands-on quizzes and assignments to reinforce learning.
Mastering Formulas and Functions: Participants will explore core Excel formulas including SUM, COUNT, IF, AND, OR, as well as advanced conditional functions like SUMIF, COUNTIF, and AVERAGEIF. The course covers date and timeline calculations, use of the caret symbol, and best practices for formula construction. Learners engage through practical exercises, quizzes, and scenario-based assignments to solidify their understanding.
Data Analysis and Scenario Management: The curriculum delves into data extraction, manipulation, and analysis using new Excel functions, pivot tables, and scenario tools. Learners practice extracting dates, sorting, filtering, and using unique and sequence functions. Assignments and quizzes are integrated to ensure practical application of data analysis skills relevant to financial modelling.
Visualization and Reporting Techniques: Students will learn to create and customize charts, including waterfall, funnel, radar, and combo charts, as well as use secondary axes and trendlines. The course covers conditional formatting for flags and highlights, and demonstrates how to present financial data effectively. Activities include hands-on chart creation and applying advanced formatting to real-world financial scenarios.
Practical Application and Advanced Tools: The course integrates practical assignments, scenario-based quizzes, and projects to apply learned concepts. Learners are introduced to data validation, goal seek, data solver, and VBA basics. The curriculum also explores the integration of Excel skills with AI tools, preparing students for evolving industry demands. Each module concludes with reflective discussions on applicability and further learning opportunities.
Advertisement

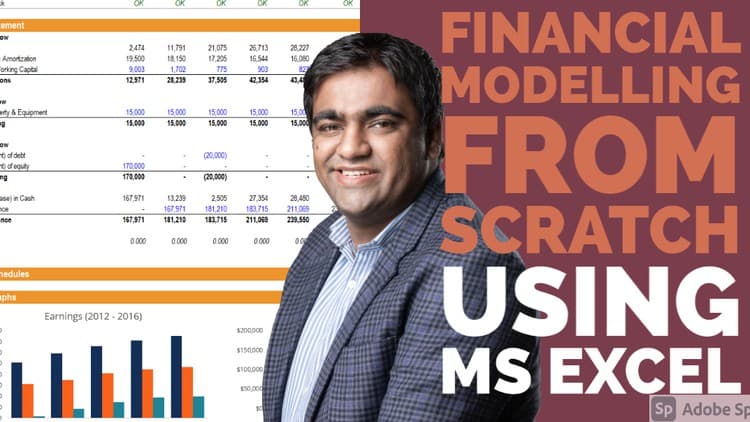

Microsoft Excel for Accounting, Finance & Financial Analysis

Beginner to Pro in Excel: Financial Modeling and Valuation
Not the best price we've seen. The lowest we've recorded is $10.99 on 28 Sept.
This is what we recorded in US pricing — not every price this course has ever had, and prices differ by country.