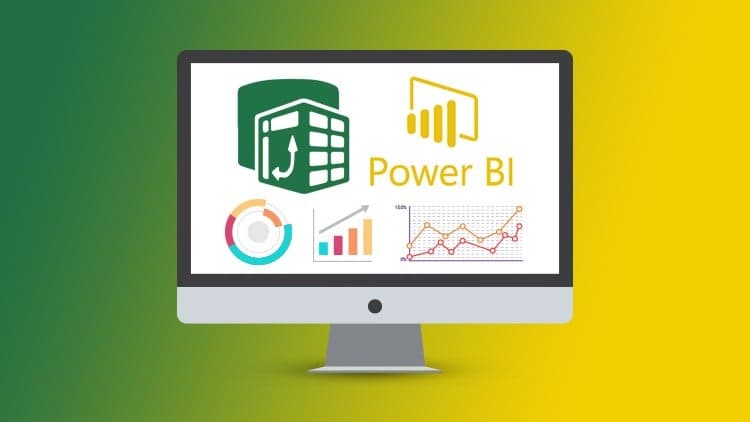
Udemy
 Udemy
UdemyPrice
No active coupon right now
View Course →No coupon right now. We'll tell you when there is one.
Mark your own learning status. Opening a course link does not establish enrollment.
Excel has a hidden power layer: Power Query automates data import and cleaning, Power Pivot builds multi-table data models, and DAX writes custom calculations without programming. Together they replace hours of manual work with dashboards that update with a click. Power BI Desktop lets you take the same skills into an even more powerful platform.
This course teaches the practical use of each tool: importing from multiple data sources, transforming messy data, defining relationships, writing time-intelligence metrics and KPIs, building interactive dashboards with slicers and 3D maps. You work with downloadable Excel files throughout, and finish by assembling a complete dashboard from scratch.
Note: Power Pivot and Power Map require Windows Excel—they're unavailable on Mac. A thirty-day money-back guarantee applies.
Essential for analysts, business professionals, and Excel users ready to multiply their impact without switching software.
Master Power Query, Power Pivot & Power BI – Build Professional Dashboards and Data Models in Excel!
If you work with data in Excel and feel like you're spending hours on tasks that should take minutes — this course will change how you work. You'll go from manually copying and cleaning data to building automated, professional-grade dashboards that update with a click.
You'll learn how to use the Excel BI Toolkit – Power Query, Power Pivot, DAX (Data Analysis Expressions), Power Map (3D Maps), and Power BI Desktop – tools that are underutilized but incredibly powerful. These features will empower you to analyze, visualize, and present your data like a pro.
Whether you're an analyst, business professional, or Excel enthusiast, you’ll discover how to create dynamic reports, stunning dashboards, and complex data models—all within Excel.
Before You Begin
Please note: Power Pivot and Power Map are only available in specific versions of Excel for Windows. They are not available on Excel for Mac.
To confirm compatibility, preview Lecture (free preview): Versions, Compatibility and Installing Power Pivot & Power Map.
Why Learn These Tools?
Today, data analysis is expected in virtually every job role. Sure, anyone can sum up a column—but not everyone can:
Automate data imports and transformations with Power Query
Build efficient data models with Power Pivot
Write powerful custom calculations with DAX
Present insights with interactive 3D maps and dashboards
Connect multiple data sources and build a single source of truth with Power BI Desktop
That’s where this course comes in. It’s your step-by-step guide to mastering these advanced tools—no programming needed.
What You’ll Learn
How to install and enable Power Query, Power Pivot, Power Map & Power BI Desktop
Import data from various sources (Excel, Access, SQL, text files & more)
Save hours of manual work by automating data cleaning with Power Query
Create complex models and relationships across multiple tables
Build custom KPIs and time-intelligence metrics using DAX — no programming needed
Build interactive Excel dashboards with slicers, KPIs & dynamic charts
Present geographic data interactively using 3D Maps
Share your reports via Power BI Desktop
By the end of the course, you’ll combine everything to create a stunning, fully-interactive dashboard from scratch.
What’s Included
Full lifetime access to all course materials
Downloadable working Excel files for hands-on practice
Certificate of Completion
Fast & friendly support
30-day money-back guarantee – no questions asked!
Who Should Take This Course?
This course is perfect for:
Excel users ready to level up their skills
Business professionals and analysts seeking to build smarter reports
Financial analysts, project managers, or operations professionals who rely on Excel daily
Anyone with basic Excel knowledge who wants to work smarter with data
You don’t need to be an Excel expert—just a willingness to learn and a Windows version of Excel that supports Power Pivot.
What Students Are Saying
“I automated a report that used to take me 3 hours. The instructor is excellent!” – Troy N.
“A thorough and well-presented tutorial on Excel BI tools. Helped me build effective dashboards.” – Albert L.
“Highly recommended for those looking to level up their data presentation skills with Excel.” – David A.
Your next data project deserves better tools. Enroll now and build your first professional dashboard today.
Advertisement
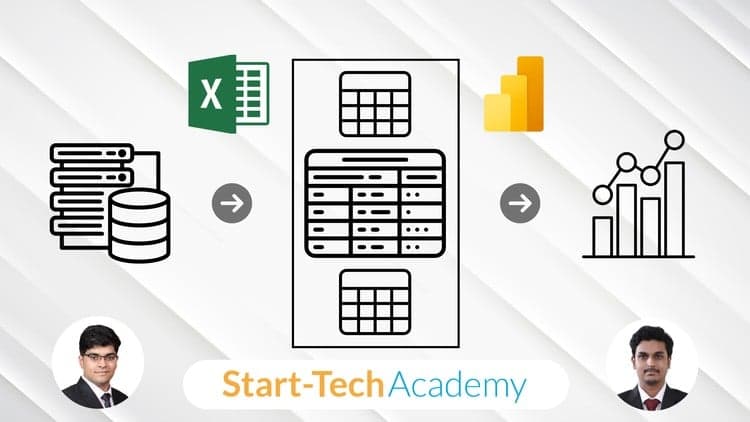


Microsoft Excel - Data Analytics Power Query and PivotTables
Microsoft Excel: Business Intelligence w/ Power Query & DAX

Master Microsoft POWER QUERY in POWER BI & Excel (ETL Tool)

Not the best price we've seen. The lowest we've recorded is $10.99 on 18 Aug.
This is what we recorded in US pricing — not every price this course has ever had, and prices differ by country.