
SponsoredUdemy
 Udemy
Free and discounted course coupons, posted every day.
Mark your own learning status. Opening a course link does not establish enrollment.
Loading saved status…
This course is aimed squarely at Excel users taking their first step into Power BI, walking through the full path from connecting a data source to publishing an interactive dashboard. It covers Power Query for transforming and cleaning data, building visuals like cards, matrices, and donut and bar charts, and the basics of DAX for calculated columns.
Beyond the fundamentals, it touches on quick measures and visual calculations, row and filter context, customizing slicers, and the AI-powered decomposition tree for exploratory analytics — plus a look at using ChatGPT to help generate report backgrounds. A quiz at the end checks your understanding of the material covered.
Excel users and complete beginners who want a structured first introduction to Power BI.
From the Udemy page
This course is designed for students and professionals looking to get started with Power BI. You will learn the fundamentals of data visualization, report building, and interactive dashboards. The course covers:
Advertisement



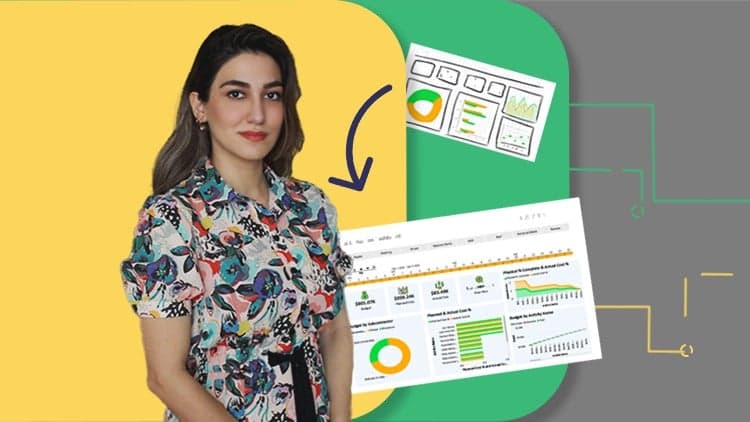

Power BI Quick Start - Create a PBI Dashboard in 90 Minutes

Power BI A-Z: Hands-On Power BI Training For Data Science!

Yes. It's free on Udemy.
No Korshub reviews yet.