
Udemy
 Udemy
UdemyMark your own learning status. Opening a course link does not establish enrollment.
This course introduces technical analysis — using charts and price patterns rather than company fundamentals — as a way to identify trends in the stock market. It covers how to set up charts, use support and resistance levels, read candlestick patterns, apply moving averages, and use indicators to spot when a stock is oversold, overbought, or shifting momentum, along with where to find free indicator tools online.
Complete beginners who feel intimidated by the stock market and want a structured, low-jargon introduction to reading charts before making trading decisions.
The stock market can feel overwhelming. Some people think they are not smart enough or that they need an advanced degree to make money trading. This simply is not true. Anyone can become successful in the market if they discipline themselves to learn what works and to apply those principles under the appropriate conditions. This course will show you how technical analysis, or the use of charts and patterns, can help you to identify market trends. This course is designed with the beginner in mind as an introduction to the world of technical analysis.
Some of the topics covered include:
· How to set up your charts
· Using support and resistance to make trades
· How to read a candle stick charts
· Using Moving Averages
· Stock Market indicators to identify trends
How to tell if a stock is oversold and possibly due for a rally
· How to access if a stock is changing its momentum
· Where to access dozens of indicators online for free
· And much much more!
Advertisement


Technical Analysis Fundamentals For Beginners (Updated 2026)
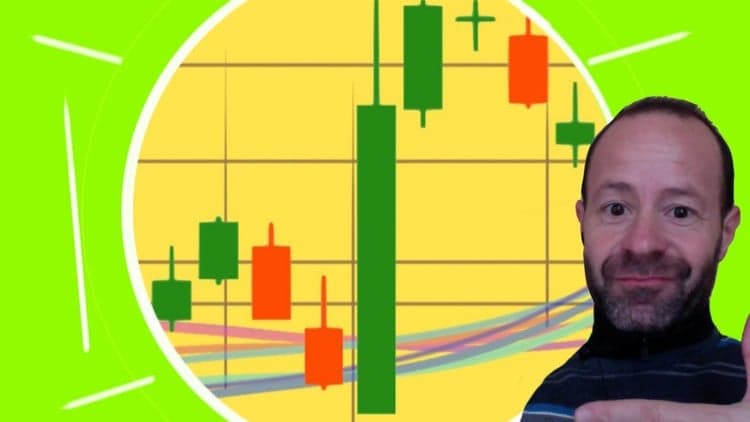
Stock Trading: Technical Analysis and Candlestick Patterns

Stock Trading Strategies : Technical Analysis MasterClass 2

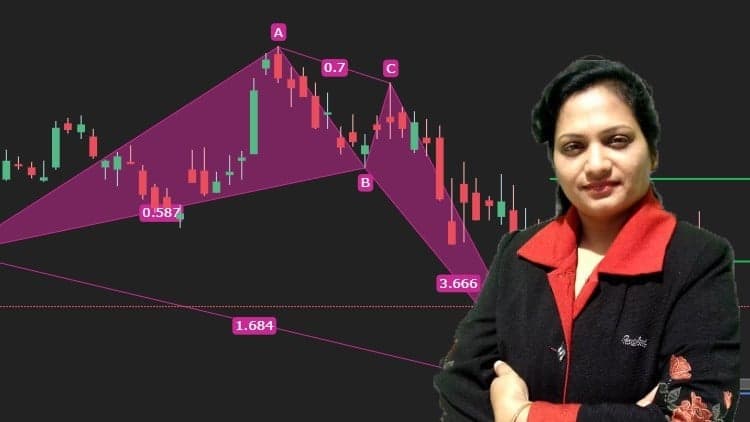
Stock & Forex Trading With Chart Pattern Technical Analysis