How to Become a Data Analyst in 2026: The Roadmap Nobody Simplifies for You
Subham Chand
Sep 16, 20265 min read9 views
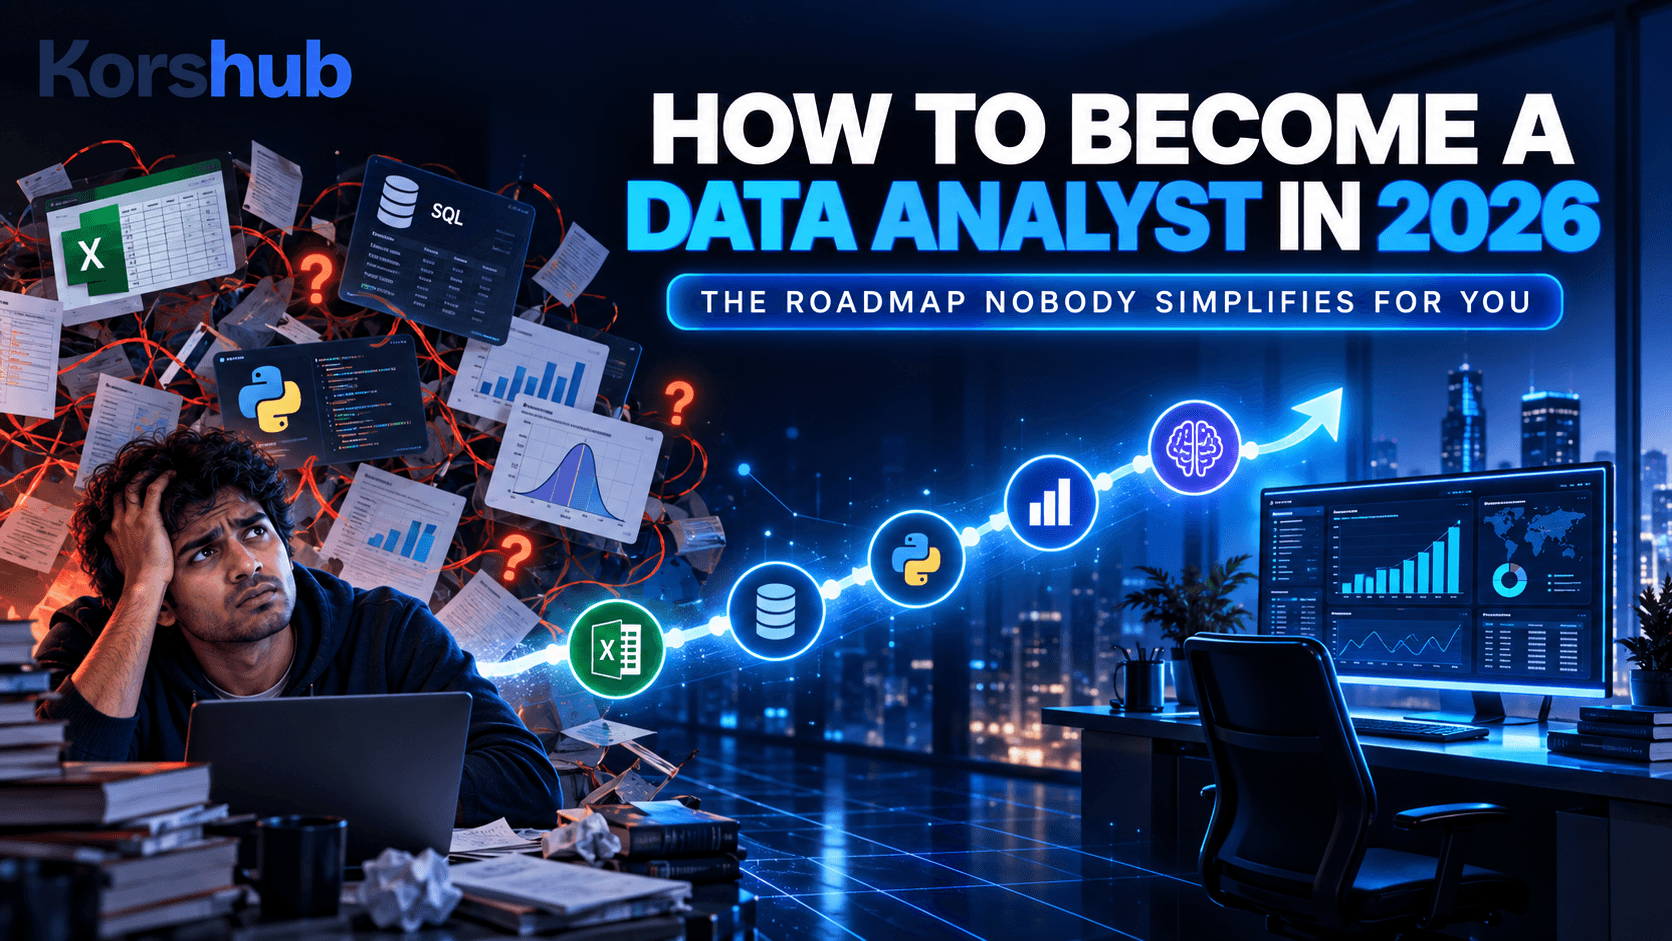
Every "how to become a data analyst" guide online lists the same five tools — Excel, SQL, Power BI, Tableau, Python — and calls it a day. What they skip is the order to learn them in, which ones actually matter for entry-level jobs, and why most self-taught learners get stuck around month two. This is the roadmap that actually addresses that.
Why "Data Analyst" Is Still One of the Safest Career Bets in 2026
Every industry — finance, healthcare, retail, marketing — now runs on data-driven decisions, which means data analysts aren't confined to tech companies anymore. The role has also split into tiers: descriptive analytics (what happened), predictive analytics (what will happen), and prescriptive analytics (what to do about it). Most entry-level jobs only expect descriptive and basic predictive skills — the advanced machine-learning layer comes later, if at all.
Advertisement
That's good news if you're starting from zero: you don't need to learn everything at once.
The Real Learning Order (Not the Listicle Order)
Most guides list tools alphabetically or randomly. Here's the order that actually mirrors how the skills build on each other:
Excel first — always. It's unglamorous, but pivot tables, VLOOKUP/XLOOKUP, and basic formulas are still how most small-to-mid-size companies handle data. Skipping this to jump straight to Python is the #1 reason beginners feel lost later.
SQL second. The moment your data lives in a database instead of a spreadsheet, SQL is non-negotiable. Joins, aggregations, and filtering queries are asked about in nearly every data analyst interview.
Statistics fundamentals. Not a full stats degree — just descriptive statistics, correlation vs. causation, and basic hypothesis testing. This is what separates "I made a chart" from "I can explain what the chart means."
Exploratory Data Analysis (EDA) with Python. Once you're comfortable with the logic from Excel and SQL, Python (via Pandas, NumPy, and Matplotlib) lets you do the same work faster and on bigger datasets.
A visualization tool — Power BI or Tableau. Pick one, not both, to start. Power BI has an edge in Microsoft-heavy companies; Tableau is more common in marketing and consulting-adjacent roles.
ETL basics and predictive analytics. This is where you move from "analyst" toward "analyst who can automate their own pipeline" — increasingly a differentiator in 2026 job postings.
The Skill Almost Nobody Mentions: Using AI Tools Inside Your Workflow
By 2026, knowing how to use ChatGPT or Grok to speed up EDA, generate SQL queries, or debug Python isn't optional — it's expected. The differentiator isn't "can you use AI," it's whether you can verify what it gives you. Interviewers are increasingly testing for that judgment, not just raw tool knowledge.
Free vs. Paid: What Actually Changes
Free resources (YouTube tutorials, free Coursera audits) are genuinely fine for learning Excel and basic SQL — those are well-documented, stable skills that don't need much hand-holding. Where structured, paid courses tend to earn their cost is in:
Sequencing — going through Excel → SQL → Stats → Python → BI tools in an order that builds correctly, instead of jumping around
Projects that combine tools — most free tutorials teach one tool in isolation; real analyst work constantly moves between Excel, SQL, and a BI tool on the same task
Staying current — covering things like Microsoft Fabric or newer AI-assisted workflows that free content often lags behind on
If you're weighing this, the Data Analytics Masters 2026 – From Basics to Advanced course follows almost exactly the learning order above: Python, EDA, statistics, Excel, SQL, Power BI/Tableau, Microsoft Fabric, predictive analytics, and ETL basics, with a section specifically on using AI tools like ChatGPT and Grok inside your analytics workflow.
What to Actually Build While Learning (So You Have Something to Show)
Employers don't hire based on which tools you "know" — they hire based on what you've built with them. Aim for at least:
One Excel dashboard from a messy, real-world-style dataset (sales data, survey responses)
One SQL project involving joins across multiple tables, not just single-table queries
One EDA notebook in Python that tells a clear story with 3–4 visualizations
One Power BI or Tableau dashboard you can screen-record a 2-minute walkthrough of
That last one matters more than people expect — in interviews, being able to talk through why you made a chart the way you did is what actually gets remembered.
Common Mistakes That Stall Beginners
Learning Python before Excel/SQL. It feels more "impressive" but leaves gaps in the fundamentals that show up later.
Collecting certificates instead of building projects. A stack of certificates with no portfolio doesn't answer the interview question "walk me through something you've built."
Trying to learn Power BI and Tableau at the same time. Pick one first; the concepts transfer once you know either.
FAQs
How long does it take to become job-ready as a data analyst in 2026?
With consistent effort (8–10 hours a week), most learners reach an entry-level-ready skill set in 4–6 months, following the Excel → SQL → Stats → Python → BI-tool order above.Do I need to know Python to be a data analyst?
Not always — some entry-level roles are Excel/SQL/BI-tool only. But Python (specifically Pandas and basic EDA) is increasingly listed as a "nice to have" or requirement in 2026 job postings, so learning it widens your options.Power BI or Tableau — which should I learn first?
Power BI if you're targeting companies already using Microsoft tools (very common in enterprise and Indian IT services companies); Tableau if you're aiming at marketing, consulting, or US-based analytics roles. Either is a fine starting point — the underlying visualization logic transfers.Is a data analytics certificate enough without a degree?
Yes, for most entry-level and many mid-level roles — as long as it's backed by a portfolio of real projects. Employers increasingly weigh demonstrated project work over the certificate itself.What's the difference between a data analyst and a data scientist?
Data analysts focus on descriptive and diagnostic work — explaining what happened and why, using SQL, Excel, and visualization tools. Data scientists go further into predictive modeling and machine learning, usually requiring deeper statistics and Python/ML skills.