
SponsoredUdemy
-85% Udemy
UdemyMark your own learning status. Opening a course link does not establish enrollment.
This course starts from a distinction that's easy to skip past: the difference between a report designer and a report consumer in Power BI. Designers have edit permissions on both the report and its underlying dataset, meaning they can open the dataset in Data view and build visuals directly in Report view — a workflow this course walks through.
Anyone who has some familiarity with Power BI and wants to move from viewing reports to actually building the visuals inside them — the insights a report is meant to surface.
A solid grounding for building your first real Power BI reports rather than just consuming someone else's.
Visualizations (known as visuals for short) display insights that have been discovered in the data. A Power BI report might have a single page with one visual or it might have pages full of visuals. It's important to make the distinction between report designers and report consumers. If you are the person building or modifying the report, then you are a designer. Designers have edit permissions to the report and its underlying dataset. In Power BI Desktop, this means you can open the dataset in Data view and create visuals in Report view.
Advertisement
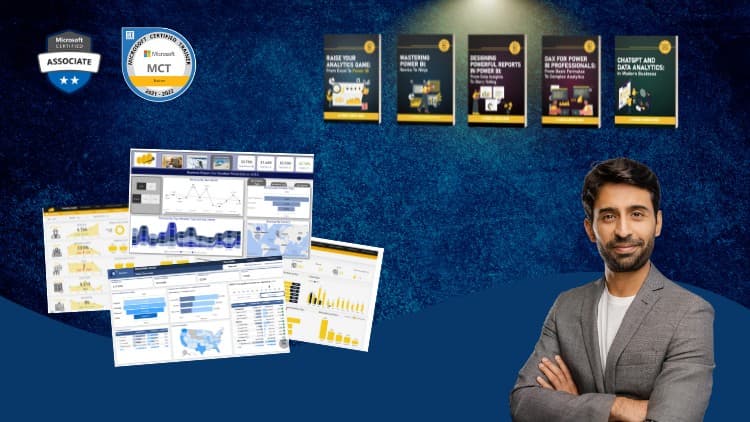


Zero to Hero in Power BI: Data Visualization using Power BI