Udemy
Free
Price
No active coupon right now
View Course →No coupon right now. We'll tell you when there is one.
Mark your own learning status. Opening a course link does not establish enrollment.
Technical analysis often feels like alchemy—pattern recognition masquerading as science. This course establishes its rational foundation: supply and demand dynamics, how price charts reveal market psychology, and behavioral finance insights explaining why patterns actually predict price moves.
Drawing on backtested results, you'll evaluate momentum indicators (moving averages, RSI, MACD, stochastics) with real historical data, not just cherry-picked examples. The course connects price-action patterns documented since the 1930s to modern behavioral economics, giving you both the tools and the conceptual understanding to apply technical analysis with genuine confidence.
In order to apply technical analysis with confidence, it is important to understand the theory of technical analysis, why it’s a rational approach to market analysis and how this discipline relates to fundamental analysis and investor psychology.
To build that confidence, we begin with an explanation of how technical analysts view the market in terms of supply and demand. We detail how the analyst develops information about the relative strength of the bulls and the bears through price charts and other tools.
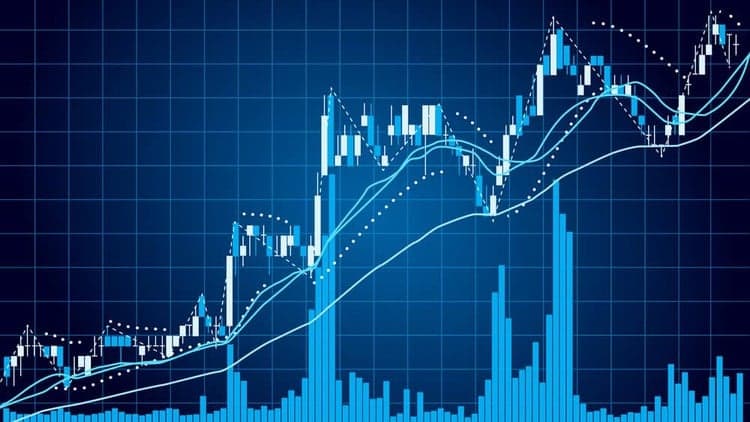
Price charts are one of the primary tools of technicians. Charts provide a history of market action and analysts can observe patterns in the chart. As early as the 1930s, analysts determined that certain patterns tended to precede certain price moves. This course reviews those patterns, discusses how to identify the patterns and supplements this with concepts form behavioral finance to explain why the patterns are predictive. Different chart types are presented and important charting concepts are explained from a practical perspective.
In addition to charts, technical analysts also use indicators and various theories to forecast the direction of prices through the study of past market data.
We focus on defining and applying momentum indicators to make buy and sell decisions. Instead of simply explaining and illustrating popular indicators like moving averages, RSI, MACD and stochastics, we review historical back tested results of each indicator so that you can objectively evaluate their performance.
Indicators based on the sentiment of various groups are analyzed and breadth indicators are explained.
In addition to indicators, theories applicable to trading are studied.
Free Preview! Access Module 1, 2, and 3 for free. For full course access, upgrade to a verified certificate.
Advertisement
Technical Analysis Fundamentals For Beginners (Updated 2026)






This is what we recorded in US pricing — not every price this course has ever had, and prices differ by country.